File:MAESCells250MaxDensityTime.png
Jump to navigation
Jump to search

No higher resolution available.
MAESCells250MaxDensityTime.png (778 × 577 pixels, file size: 44 KB, MIME type: image/png)
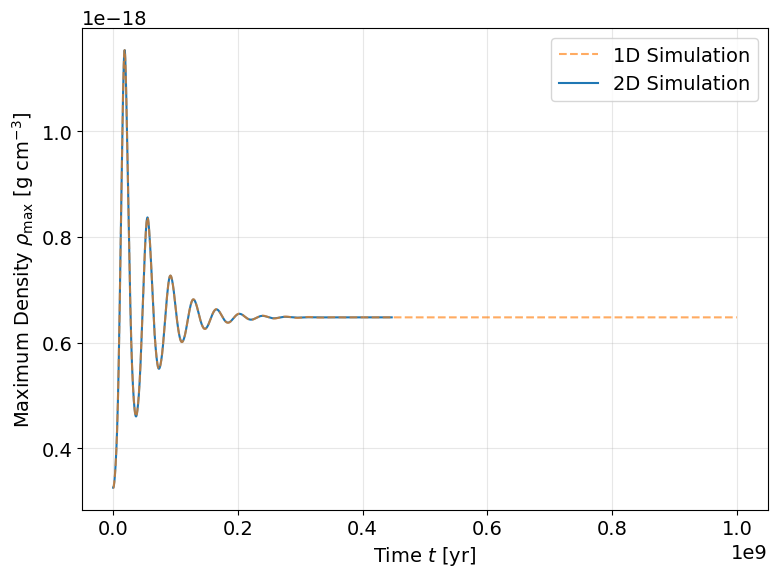
Time evolution of the maximum density \(\rho_{\max}(t)\) for the 2D reference run (solid line) compared to the corresponding 1D simulation with \(N_r=250\) (dashed line).
File history
Click on a date/time to view the file as it appeared at that time.
| Date/Time | Thumbnail | Dimensions | User | Comment | |
|---|---|---|---|---|---|
| current | 18:58, 9 January 2026 | | 778 × 577 (44 KB) | Emilio.S (talk | contribs) |
You cannot overwrite this file.
File usage
The following page uses this file: