File:MAES-MasslossAtXbeg.png
Jump to navigation
Jump to search

No higher resolution available.
MAES-MasslossAtXbeg.png (724 × 539 pixels, file size: 43 KB, MIME type: image/png)
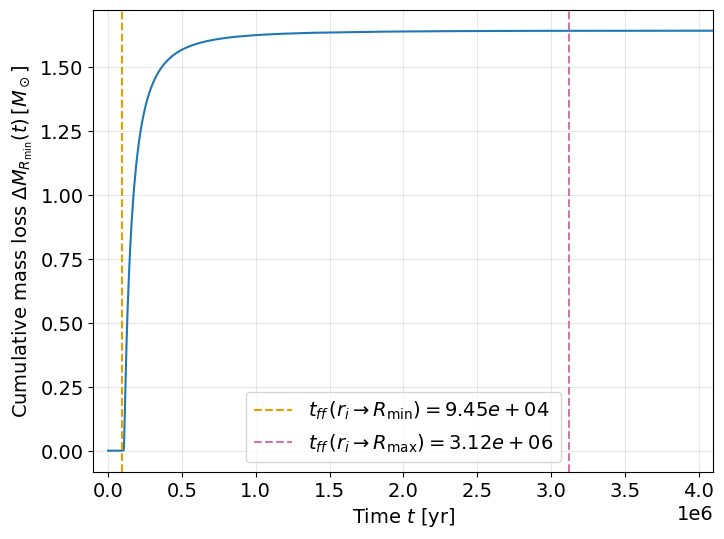
Temporal evolution of the cumulative mass loss \(\Delta M_{R_{\min}}(t)\) across the inner boundary \(R_{\min}\). The vertical dashed lines mark the free fall times determined from the normalized mass loss, with tolerance \(\varepsilon=10^{-4}\), for the limiting cases \(r_i \to R_{\min}\) (orange) and \(r_i \to R_{\max}\) (magenta).
File history
Click on a date/time to view the file as it appeared at that time.
| Date/Time | Thumbnail | Dimensions | User | Comment | |
|---|---|---|---|---|---|
| current | 10:24, 20 January 2026 | | 724 × 539 (43 KB) | Emilio.S (talk | contribs) |
You cannot overwrite this file.
File usage
There are no pages that use this file.