File:MAES-BoundaryInwardMassFluxAtXbeg.png
Jump to navigation
Jump to search

No higher resolution available.
MAES-BoundaryInwardMassFluxAtXbeg.png (777 × 578 pixels, file size: 56 KB, MIME type: image/png)
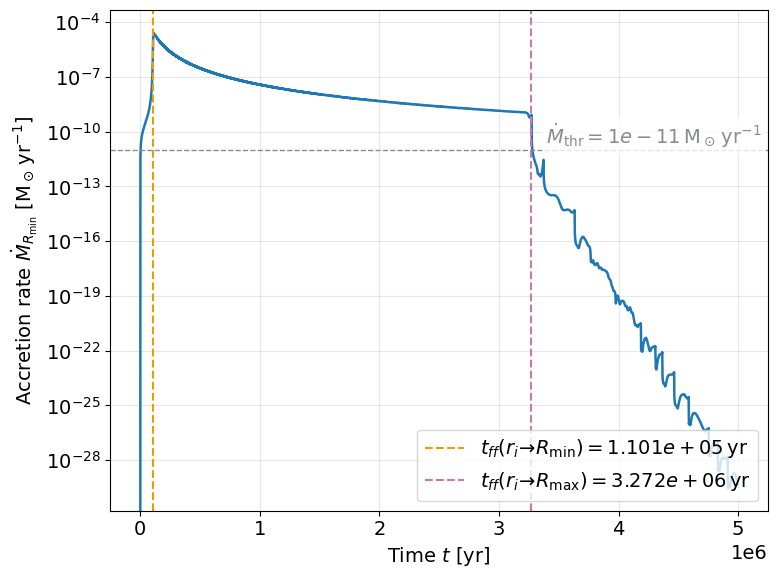
Temporal evolution of the accretion rate across the inner edge \(\dot{M}_{R_{\min}}(t)\). The horizontal dashed line marks the detection threshold \(\dot{M}_{\mathrm{thr}} = 10^{-11}\,M_\odot\,\mathrm{yr}^{-1}\). The vertical lines mark the determined free-fall times of the boundary cases. \(t_{\mathrm{ff}}(r_i \rightarrow R_{\min})\) as the time of the first significant peak and \(t_{\mathrm{ff}}(r_i \rightarrow R_{\max})\) as the last time immediately before the abrupt drop in the accretion rate.
File history
Click on a date/time to view the file as it appeared at that time.
| Date/Time | Thumbnail | Dimensions | User | Comment | |
|---|---|---|---|---|---|
| current | 14:31, 13 February 2026 | | 777 × 578 (56 KB) | Emilio.S (talk | contribs) |
You cannot overwrite this file.
File usage
The following page uses this file: