File:MAES-ColormapDensityrzphi0AxialDensityProfile.png
Original file (2,048 × 459 pixels, file size: 296 KB, MIME type: image/png)
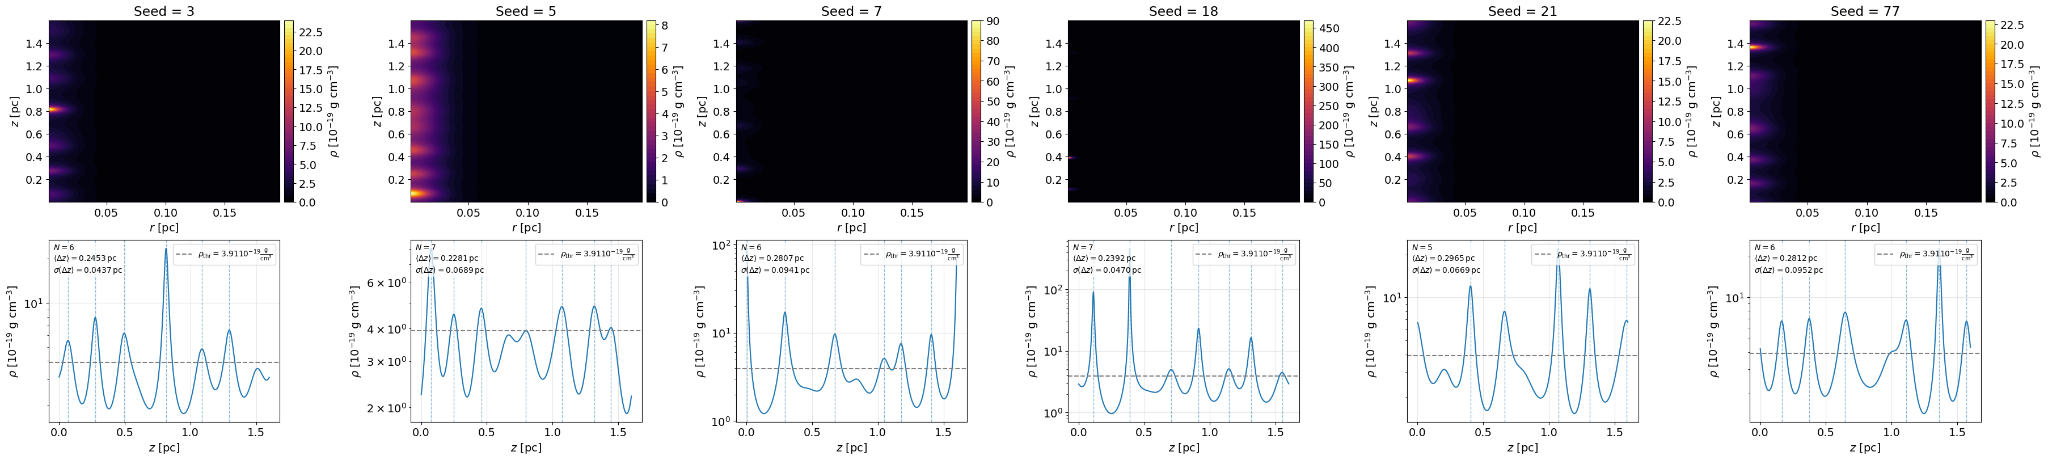
Density distributions and corresponding axial density profiles for \(Z_{\max} = 1.6\,\mathrm{pc}\) and \(r_0 = 0.033\,\mathrm{pc}\) at a time close to \(12.5\tau\), shown for the seeds \(3\), \(5\), \(7\), \(18\), \(21\) and \(77\). The upper row shows the density distribution in the \(rz\)-plane at \(\varphi \approx 0\), while the lower row shows the corresponding axial density profiles at \(r \approx 0\). The gray horizontal dashed line marks the threshold \(\rho_{\mathrm{thres}}\) used for peak detection, and the blue vertical dashed lines indicate the positions of the counted local maxima from which the mean fragment spacing is determined.
File history
Click on a date/time to view the file as it appeared at that time.
| Date/Time | Thumbnail | Dimensions | User | Comment | |
|---|---|---|---|---|---|
| current | 12:00, 19 April 2026 | 2,048 × 459 (296 KB) | Emilio.S (talk | contribs) |
You cannot overwrite this file.
File usage
The following page uses this file: