File:MAES-Cells250MaxDensityDensityProfilePotential.png: Difference between revisions
Jump to navigation
Jump to search
(Emilio.S reverted File:MAES-Cells250MaxDensityDensityProfilePotential.png to an old version) |
(Emilio.S reverted File:MAES-Cells250MaxDensityDensityProfilePotential.png to an old version) |
(No difference)
| |
Latest revision as of 17:04, 8 January 2026
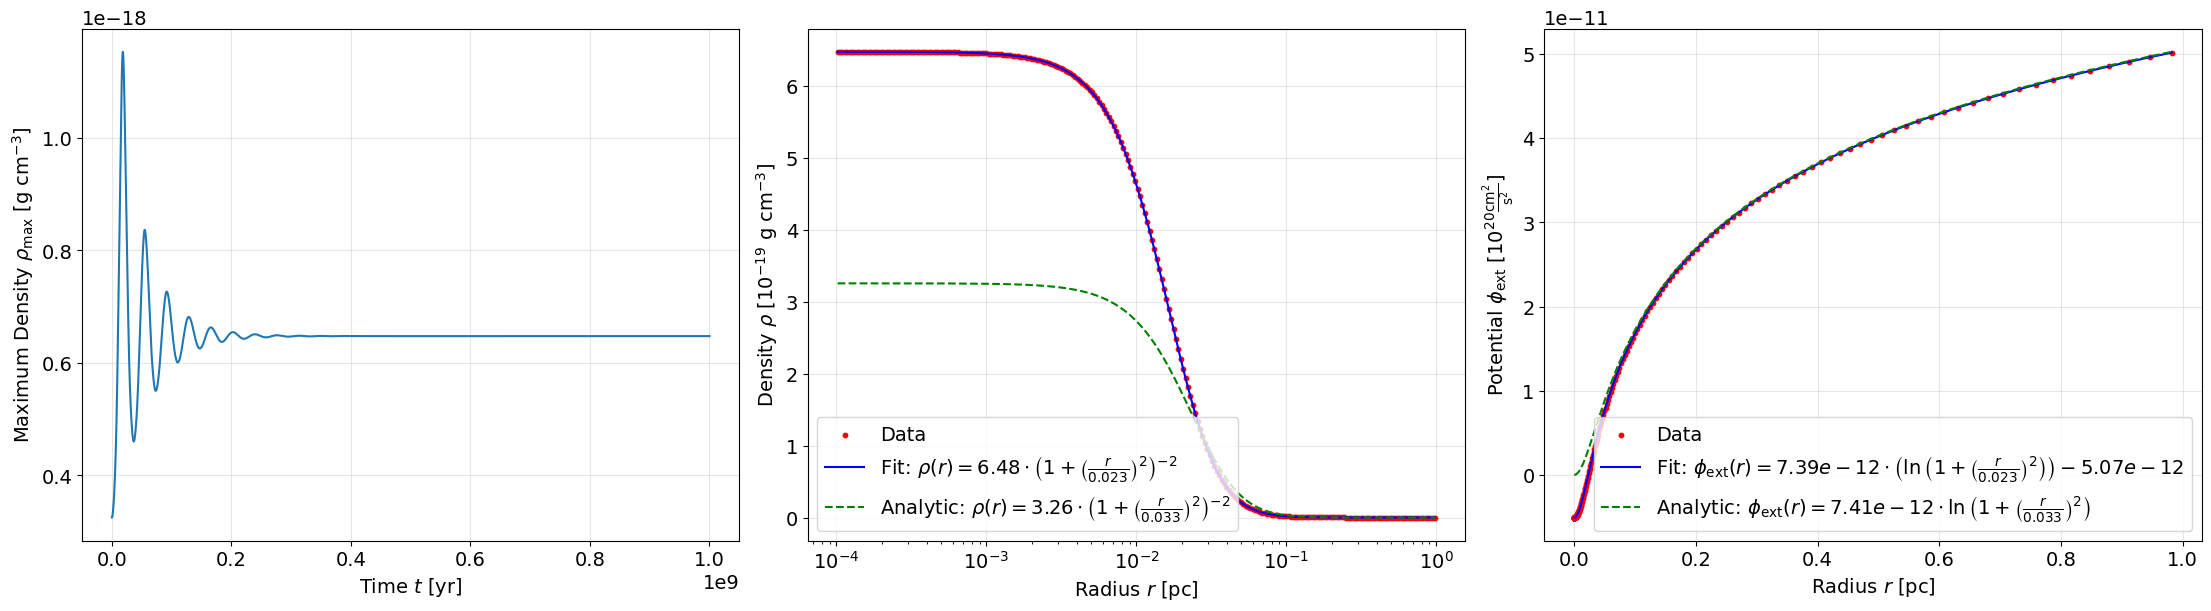
2D reference run (\(N_r=250\)): Time evolution of the maximum density \(\rho_{\max}(t)\) (left), radial density profile \(\rho(r)\) with fit and analytical solution (centre) and gravitational potential \(\phi_{\mathrm{ext}}(r)\) with fit and analytical solution (right).
File history
Click on a date/time to view the file as it appeared at that time.
| Date/Time | Thumbnail | Dimensions | User | Comment | |
|---|---|---|---|---|---|
| current | 17:04, 8 January 2026 | 2,211 × 611 (118 KB) | Emilio.S (talk | contribs) | Reverted to version as of 16:02, 8 January 2026 (CET) | |
| 17:03, 8 January 2026 | 2,211 × 611 (117 KB) | Emilio.S (talk | contribs) | Reverted to version as of 15:58, 8 January 2026 (CET) | ||
| 17:02, 8 January 2026 | 2,211 × 611 (118 KB) | Emilio.S (talk | contribs) | Axis labelling gravitational potential | ||
| 16:58, 8 January 2026 | 2,211 × 611 (117 KB) | Emilio.S (talk | contribs) |
You cannot overwrite this file.
File usage
The following page uses this file: